
Balanced Real Estate Market Prevailed Through Much of 2011
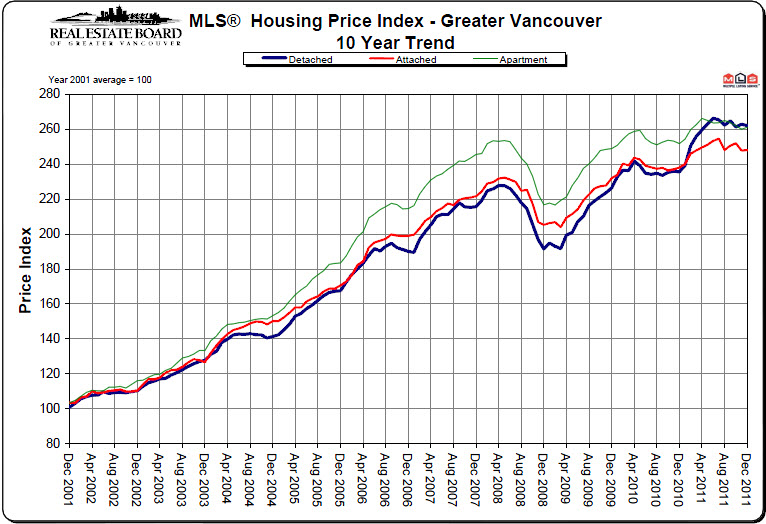
VANCOUVER, B.C. – January 4, 2012 – The 2011 Greater Vancouver housing market began with heightened demand in regional hot spots and concluded with greater balance between seller supply and buyer demand.The Real Estate Board of Greater Vancouver (REBGV) reports that total sales of detached, attached and apartment properties in 2011 reached 32,390, a 5.9 per cent increase from the 30,595 sales recorded in 2010, and a 9.2 per cent decrease from the 35,669 residential sales in 2009. Last year’s home sale total was 6.3 per cent below the ten-year average for annual Multiple Listing Service® (MLS®) sales in the region.The number of residential properties listed for sale on the MLS® in Greater Vancouver increased 2.7 per cent in 2011 to 59,549 compared to the 58,009 properties listed in 2010. Looking back further, last year’s total represents a 12.8 per cent increase compared to the 52,869 residential properties listed in 2009. Last year’s listing total was 11.1 per cent above the tenyear average for annual Multiple Listing Service® (MLS®) property listings in the region.“It was a relatively balanced year for the real estate market in Greater Vancouver with listing totals slightly above historical norms and sale numbers slightly below,” Rosario Setticasi, REBGV president said. Residential property sales in Greater Vancouver totalled 1,658 in December 2011, a decrease of 12.7 per cent from the 1,899 sales recorded in December 2010 and a 29.7 per cent decline compared to November 2011 when 2,360 home sales occurred.More broadly, last month’s residential sales represent a 34.1 per cent decrease over the 2,515 residential sales in December 2009, a 79.4 per cent increase compared to December 2008’s 924 sales, and a 12.6 per cent decrease compared to the 1,897 sales in December 2007.The overall residential benchmark price, as calculated by the MLSLink Housing Price Index®, for Greater Vancouver increased 7.6 per cent to $621,674 between Decembers 2010 and 2011. However, prices have decreased 1.5 per cent since hitting a peak of $630,921 in June 2011.“Our market remained in a balanced state for most of the year, although higher levels of demand for detached properties in the region’s largest communities caused prices in certain areas to rise higher than others,” Setticasi said. “For example, the benchmark price of a single-family detached home experienced double-digit increases in nine areas within the region over the last 12 months.”New listings for detached, attached and apartment properties in Greater Vancouver totalled 1,629 in December 2011. This represents a 4.1 per cent decline compared to the 1,699 units listed in December 2010 and a 49.4 per cent decline compared to November 2011 when 3,222 properties were listed.Sales of detached properties in December 2011 reached 630, a decrease of 18.1 per cent from the 769 detached sales recorded in December 2010, and a 30.2 per cent decrease from the 902 units sold in December 2009. The benchmark price for detached properties increased 11.2 per cent from December 2010 to $887,471.Sales of apartment properties reached 774 in December 2011, a decline of 4.6 per cent compared to the 811 sales in December 2010, and a decrease of 32.9 per cent compared to the 1,154 sales in December 2009.The benchmark price of an apartment property increased 3.7 per cent from December 2010 to $401,396.Attached property sales in December 2011 totalled 254, a decline of 20.4 per cent compared to the 319 sales in December 2010, and a 44.7 per cent decrease from the 459 attached properties sold in December 2009. The benchmark price of an attached unit increased 4.2 per cent between December 2010 and 2011 to $511,499.
Full stats available at: http://www.rebgv.org/


 778-388-1359 Mobile |
  604-714-1700 Office